Many of us never consider the size of an iOS app until we have a massive one that sizes tens of MB or, worse, hundreds of MB. That is precisely what happened to us at Rappi.
There are several ways to tackle this situation:
First, you must measure the size of your application and how it grows to identify which modules or assets are the worst offenders. My colleague Moy has an excellent post about this. If you haven’t read it, check it out here.
Now that you know where the big problems are, you can start by applying the most common techniques to reduce your app’s size. Some of them are: removing duplicated code and assets, enabling whole-module optimization, and size optimization for swift and clang compilers.
Check out this iOS App Size Reduction Cheatsheet to see how to do it.
But what happens when that is not enough? For example, when your app is so large that even after applying those techniques, you still have a binary of hundreds of MB, such as Rappi.
We need to find big solutions for big problems, and fortunately, we discovered a vast article and paper from Uber where they faced the same problem. Please check it out; it will help you understand this post.
As mentioned in the above paper, the key to this implementation is the machine outlining throughout the entire app.
Wait… what?
Machine Outlining
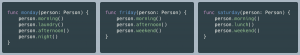
All of us have done outlining in the past. Let’s look at the following code snippets that represent a person’s itinerary:
Baseline:
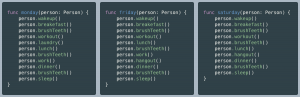
🛠 Lines of code:
🔹 func friday = 13
🔹 func saturday = 12
🔺 Total = 38
Did you notice something? I’m sure you did. It seems that this person has some habits repeated throughout the days, so there are lines of code that can be extracted to reuse them. We can extract the code with the following methods to avoid duplicating code multiple times:
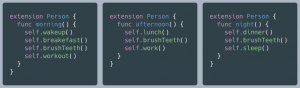
🛠 Lines of code (without extension declaration):
🔹 func morning: 6
🔹 func afternoon: 5
🔹 func night: 5
By doing this, we can rewrite our main methods like this:
Outline 1:
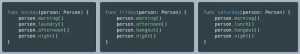
🛠 Lines of code:
🔹 func monday = 6
🔹 func friday = 6
🔹 func saturday = 6
🔹 func morning = 6
🔹 func afternoon = 5
🔹 func night = 5
🔺 Total = 34
Congratulations! That’s Outlining. You already knew it; you just learned what it’s called.
Applying the same concept, now you can infer that Machine Outlining is pretty much the same but used at low-level code (assembly code).
Click here for an example of Machine Outlining explained with low-level code.
But that’s not all; we are going to do the outlining several times. As shown in the image below, there is still a chance to do it again after this first round.
So let’s do it
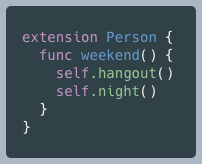
🛠 Lines of code (without extension declaration):
🔹 func weekend = 4
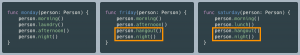
Outline 2:
🛠 Lines of code:
🔹 func monday = 6
🔹 func friday = 5
🔹 func saturday = 5
🔹 func morning = 6
🔹 func afternoon = 5
🔹 func night = 5
🔹 func weekend = 4
🔺 Total = 36
There are no more combinations to extract, but there will be cases where we can do it many times.
And now you wonder why did we do all of this? What’s the purpose?
Well, let’s count how many lines of code we had before and how many we have now (I will omit the extension declarations because they are not strictly necessary)
Baseline: 38 lines
Outline 1: 34 lines
Outline 2: 36 lines
In the case of “Outline 1”, we reduced only four lines of code compared to Baseline, but what if our source code (taking third-party libraries into account) has millions of lines of code? We can probably find more patterns and reduce many more lines of code.
Here are the machine outliner stats of Rappi. It found over 4 million patterns, and those were extracted in about 200 thousand functions.
200,995 machine-outliner — Number of functions created
4,034,483 machine-outliner — Number of candidates outlined
That’s a massive reduction of approximately 8.5% of the app size without changing a single line of code.
Did you notice that in ‘Outline 2’, the number of lines of code increased compared to the first round?
There are a number of rounds in which you can get the maximum reduction of size. For the example above, it is only one, but for Rappi, it was five times.
Doing it more times at best will only decrease the size a bit, but it’s probably not worth it, considering the amount of time it takes. At worst, it will increase the binary size like in this example.
How to Do Machine Outlining
In the following diagram, you can see a normal Xcode archive that uses whole-module optimization, bitcode enabled, and static libraries:
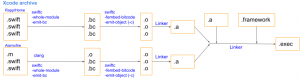
But first, a glossary:
.bc are bitcode files (don’t confuse them with Bitcode with uppercase B). bitcode files are an intermediate representation (IR) used by LLVM. At first glance, bitcode files cannot be read but can be transformed into human-readable LLVM assembly code (.ll) with the llvm-dis tool.
.o are object files (Mach-O), basically machine code for a specific architecture, so it is no longer possible to read or transform it into assembly code.
.a are static libraries. It’s just a package for .o files
Now let’s look at a pipeline that makes machine outlining possible:
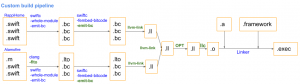
Unlike Xcode, we are not creating static libraries. We are not even creating Mach-O files (just one at the end). We link all the IR files (.bc and .lto) into a single file (.ll) to optimize it and run the machine outlining throughout the app.
I highlighted the differences to the default Xcode Archive in green. Let’s review them:
llvm-link
Do you remember that I mentioned this before?
“The key of this implementation is the machine outlining throughout the entire app.”
Well, you know what Machine Outlining is, but what about “ throughout the entire app”? That’s where llvm-link takes place.
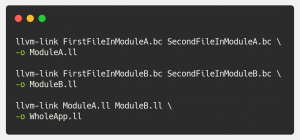
llvm-link is a tool from the LLVM project:
llvm-link takes several LLVM bitcode files and links them together into a single LLVM bitcode file
Eureka! We can use the llvm-link tool to link the entire app into a single file. As the diagram shows, we will first connect the application by modules (RappiHome.ll, Alamofire.ll, etc.), and then we will link all the modules to obtain WholeApp.ll
-flto, -emit-bc
According to the llvm-link definition, we need bitcode files (remember, with lowercase b). Originally in Xcode, we produce .o files after the compilation phase. In order to create IR files (.bc, .lto), we need to pass -flto flag to clang compiler (to produce .lto), and -emit-bc to swift compiler (to produce .bc).
To add -flto flag to clang compiler, we need to enable LTO in Build Settings:
- Select your target > Build Setting > Apple Clang — Code generator > Link-Time Optimization > Release > Monolithic
To add -emit-bc to swift compiler, we need to pass it the flag:
- Select your target > Build Setting > Swift Compiler — Custom Flags > Release > -Xfrontend -emit-bc
As you will see later, we only added the LTO flag because the -emit-bc flag was added in a custom step outside of Xcode.
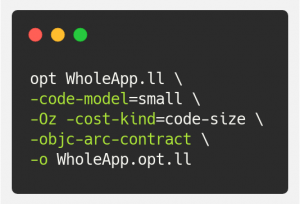
OPT
OPT is a tool from the LLVM project:
The opt command is the modular LLVM optimizer. It takes LLVM source files as input, runs the specified optimizations, and then outputs the optimized file.
It takes the IR (.ll) file generated by llvm-link to optimize it by cutting some KB and executing the ARC contract. If we don’t do this, the pipeline will fail with:
- LLVM ERROR: Cannot select: intrinsic %llvm.objc.clang.arc.use
I learned it the hard way:
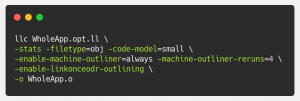
llc
This is the one in charge of doing the Machine Outlining. llc is a tool from the LLVM project:
The llc command compiles LLVM source inputs into assembly language for a specified architecture. The assembly language output can then be passed through a native assembler and linker to generate a native executable.
It takes the IR file issued by the OPT, runs the Machine Outlining several times, and finally produces a Mach-O (.o) file for a specific architecture (arm64 in this case).
Pipeline
What you need to know
The actual pipeline we built is slightly different than the one I showed before. Let’s look at it:
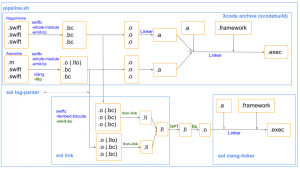
It’s different because we start with a default Xcode Archive and then use a lot of files from there, that’s why some extensions are .o, but they are marked as .bc or .lto. This is because we reuse a file called <TargetName>.LinkFileList that contains all the object files to link (with extension .o). And it was easier to overwrite those .o files than to modify each LinkFileList existing in the project.
I made the pipeline in a shell script (pipeline.sh).
https://github.com/lu15gv/sol/blob/main/Executables/pipeline.sh
Also, I made an Xcode swift console project (SizeOptimizerLinker or sol)
https://github.com/lu15gv/sol/tree/main/Sources/SizeOptimizerLinker
It parses xcodebuild.log for essential data (derived data paths, clang linker arguments, certificate id), wraps the llvm-link tool (due to the limit of arguments that llvm-link can take), and also performs the final clang linking excluding the original static library parameters (since they were linked with llvm-link).
This is the GitHub project where you can get the full implementation and a sample project (of course, we can’t share the actual Rappi project)
You will also need the LLVM tools (llvm-link, opt, llc). Depending on your current version of Xcode, there is a specific version of the tools you should use. You can get them here.
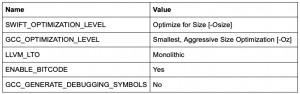
Xcode Configuration
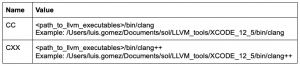
We need to use LTO, optimization flags, and the custom clang compiler that contains LLVM PRs changes.
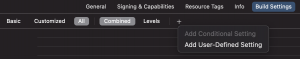
Go to Build Settings, find the following flags and replace their values by following the table below (for release settings only!)
Also, add two User-Defined Settings
Run the Pipeline
Clone the sol project:
https://github.com/lu15gv/sol/tree/main/LLVM_tools
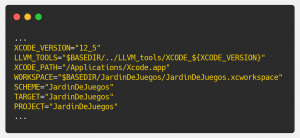
Open the runme.sh that it’s in the Example directory with a text editor.
Replace the section “Configure this.”
This is an example of the setup to optimize the example project.
There is an optional section where you can configure the following options:
TARGETS_WHITE_LIST: this allows you to exclude some Targets to be linked. This is useful when you use CocoaPods and want to exclude the target Pods-<YourTargetName>
JSON_SYMBOLS: this allows you to replace symbols. It’s useful when you have duplicated symbols, and Xcode shows them as a warning. There’s a JSON example here.
Now, you need to open a terminal window and run:
sh <path to sol project>/Example/runme.sh
It will print information for each step and generate files in a few places:
- In <path to sol project>/Example/outputs you will find the logs, some support files, a symbolic link pointing to the optimized archive, and debug files for Bitcode and DSYM (we’ll talk about these two later)
- In ~/Library/Developer/Xcode/DerivedData/<your project>/Build/Intermediates.noindex/ArchiveIntermediates/<your project>/IntermediateBuildFilesPath/optimized/arm64 you will find intermediate optimized files such as:
WholeApp.LinkFileList
WholeApp.ll
WholeApp.opt.ll
WholeApp.o - The optimized archive can be opened in Xcode Organizer and distributed like any other normal archive (or not 👀, see problems below)
Results
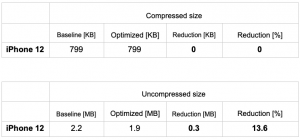
The following table shows the reductions we had in Rappi when applying this method. These results were taken directly from Testflight in AppStore Connect.
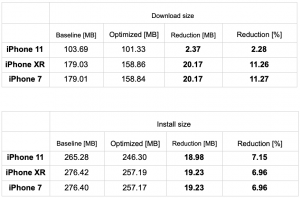
As you can see, the reduction differs between models, but on average we could cut 7% of install size and 8.5 % in download size.
For the example project, I exported the archive (Ad-Hoc) and I got the next results (App Thinning Size Report.txt)
In this case, we got good results, yay!
In any case, the example is just a guide. You should refer to the FAQ section because this method does not always work well with small projects.
DSYMs:
This used to be a problem, but we were able to solve it 🎉.
Here you can see what the problem was.
How to make them work?
We need to disable “Generate Debug Symbols” in target build settings. This removes the -g flag during compilation time and allows us to generate the DSYMs later.
Disclaimer:
It’s possible to find crashes happening in methods called “OUTLINED_2342” (or any other number). This is a product of the machine outliner, but don’t worry. If you look at the stack trace, you will find the original method.
Problems
There is one error that we have not been able to solve:
Bitcode:
The Bitcode got corrupted after this process, and there is an XML embedded next to the Bitcode section in the binary.
https://jonasdevlieghere.com/embedded-bitcode/
That XML is the one that got corrupted, and it is impossible to rebuild the app from the Bitcode. There is an open discussion on LLVM Discourse that explains the issue in detail:
https://llvm.discourse.group/t/bitcode-xml-xar-corrupted-after-llvm-link/3295
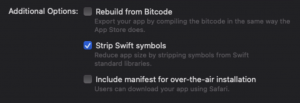
We ended up deactivating Rebuild from Bitcode when uploading it to the App Store.
FAQs
- Does it work in any project?
It doesn’t. We only recommend it for large projects. You may not find any size reduction on small projects with few targets when doing the Machine Outlining. You can even increase its size.
- Does it currently support dynamic frameworks?
Short answer: not yet.
Long answer: look at the last diagram of the pipeline. The original static libraries are not present because we only need the original bitcode files (.bc) generated before the static libraries (.a). So, in theory, this can also support dynamic frameworks because the .bc files will exist too, but it will require some tweaking to the SizeOptimizerLinker project, which I haven’t done.
- Does it support Bitcode?
It doesn’t for now. You can check the Problems section of this article for more details.
- What happened with symbolization and DSYMs?
It works. See the DSYMs section of this article for more details.
- Is it in production?
The app has passed the first quality control and is fully functional. We are about to release it soon.