Introduction
It’s a quiet night at the Phoenix Community Hospital when suddenly, a noise wakes up senior medical resident Lisa Brown. It’s the pager indicating a code blue on level one. When Dr. Lisa arrives, she finds her patient in critical condition. She looks at the patient’s vitals on the monitor, and they are not looking good: The patient’s pulse and oxygen saturation are dropping very quickly…
Hello, my name is Omar Rojina. I’m a Site Reliability Engineer at Wizeline and, as you may have noticed, a big fan of emergency room TV shows (“ER,” “Dr. House,” “The Good Doctor,” etc.)
Throughout my professional career, I have been involved in projects that have required me to be on an on-call schedule – that is, being available at any time in case something really bad happens to our system. Well, it turns out that being paged in the middle of the night to attend to a SEV 1 incident (like the system being down) looks pretty similar to what paramedics or doctors do (at least on TV) when they are paged to handle a medical emergency like a patient having a heart attack.
Overview
In this post, I will use an analogy of a medical emergency to explain some of the terminology and concepts around observability. This doesn’t mean that the only use case for observability is in the context of an emergency, but I think framing it in this way will emphasize the importance of having a good observability platform available for our systems. Let’s jump right in…
What Is Observability and Why Do I Need It?
During an emergency, several unknowns and questions arise; so, the first thing an SRE or doctor typically does when they arrive at the scene is to get as much relevant information as possible in the shortest period of time in order to understand the situation and define next steps. Notice that I used the word “information” as opposed to just “data.”
But here’s the thing: SREs and doctors deal with complex systems. While SREs deal with microservices architectures – a collection of services running in containers as part of a larger distributed system running in the cloud – doctors deal with the human body – a collection of different systems each composed of several organs, tissues, and other structures that are interconnected and form a bigger system. In either case, understanding these intricate systems is not an easy task.
In an emergency context, SREs and doctors share the same goals:
- Mitigation: Stabilizing the system (patient); in other words, bringing the system back to a more “manageable” (healthy) state
- Diagnosis: Determining the root cause of the problem
- Treatment: Applying a permanent fix
To accomplish these goals, SREs use techniques that aid in the process of:
- Collecting data
- Monitoring data
- Analyzing data
In turn, they can ask the necessary questions about the system and get answers regarding its current state, plus understand how well (or poorly) the system performs.This is called observability, or O11Y.
So, exactly what kind of data are we collecting, monitoring, and analyzing here? Well, that is a good question. In order for a system to be observable, it must generate records for telemetry.
Telemetry: The Core of Observability
- Doctors are focused on the patient’s telemetry:
- Pulse rate
- Body temperature
- Blood pressure
- Respiration rate
- SREs, on the other hand, are concerned with the system’s telemetry:
- Events
- Logs
- Metrics
- Traces
Doctors and SREs use different tools to gather the relevant telemetry data. The way these tools are implemented is crucial. What I mean by this is that the tools must be used in such a way that the user (the SRE or doctor) gets as much vital information (facts put into context) as possible in the shortest amount of time.
Further, the tools should enable them to see when something is going outside of the normal threshold. Ideally, this should be an automated process that centralizes all the data and presents it in a way that is as easy as possible to interpret and understand.
Let’s continue using our analogy to explain each type of telemetry data an SRE deals with.
Events:
Specific, discrete happenings in a system.
Think of them as things that occur in the human body, like waking up, sneezing, eating, etc. Some events may have a bad connotation (pain, numbness, vomiting, fever, dizziness, fainting, tremors, etc.) and can be seen as symptoms in a patient’s body.
In an SRE’s world, an event could be a “purchaseEvent” or a “loggingEvent” on an e-commerce site, or a warning or error message in an application.
Logs:
Lines of text that a system produces when certain code blocks get executed.
In our analogy, logs would be similar to a record book of all the things happening to a patient. For example:
“At 11:04 a.m. on 04/22/2022, a piece of chocolate cake was eaten.”
A parallel example in a system would be a log entry such as the following being written if a user tries to log in to a website using a wrong password:
2022-04-22 11:04:00 [ERROR] Login failed, wrong username or password!
Metrics:
A numeric measurement tracked over time. Examples of patient metrics could be:
- At 11:04 a.m. on 04/22/2022, the patient’s body temperature was 37 degrees Celsius.
- At 11:04 a.m. on 04/22/2022, the patient’s heart rate was 85 beats per minute.
System metrics might look something like this:
- [2022-04-22 11:04:00] node_memory_MemFree_bytes=2786098
- [2022-04-22 11:04:00] http_requests_total=1535
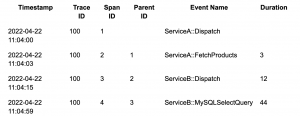
Traces:
The footprints left in our bodies by viruses, bacteria, or toxins. Medical examiners may use traces to determine the cause of a patient’s death, by studying tissue, organs, cells, and body fluids and following the tracks.
To an SRE, traces are samples of causal chains of events between different components in a microservices ecosystem. Each individual event is called a “span,” and each span shows its relationship with a parent span. Spans without a parent_id are identified as root spans. This parent-child relationship in spans allows us to track down a series of events in a chronological way.
Conclusion
As you can imagine, with all this data at our disposal in a centralized platform, there are several things we can do, including but not limited to:
- Building dashboards to visualize, monitor, analyze, and correlate data
- Setting up thresholds for well-known metrics
- Creating alerts
Remember: The goal of an observability platform is to help you understand the current state of a system and how well (or poorly) the system performs. The more questions about your system your O11Y platform is able to answer, the better your O11Y platform is.
I hope this analogy has helped you to understand what observability is, to grasp some of its core concepts, and to see why it is important for your business. Next time you visit your doctor for a blood pressure checkup, you can say confidently: “You have good observability there, doc!” See you next time!
Ready to Become a Wizeliner? Apply Today!
Are you interested in joining our global team at Wizeline? We have open roles for engineers in Mexico, Colombia, Vietnam, and Spain. Apply here.